
This is how the bike-sharing trends in New York look like
Bike-sharing is marketed as a means of transportation that is cheaper than taxis or subway passes, saves time when going crosstown, gives a healthy dose of exercise, and is good for the environment. All those benefits are just plain facts. What I wanted to know is whether people do find it convenient and like to use it?
In order to find an answer to this question, I decided to analyze the publicly available Citi Bike trip data. Having 20,000 bikes and over 1,300 stations across Manhattan, Brooklyn, Queens, the Bronx and Jersey City, the Citi Bike collects a large volume of data.
I aggregated the data and obtained a daily number of rents between the 1st of January 2019 and the 31st of May 2021. Then I used this as an input to model the trends and seasonalities. In the following chart, you can see how well the model follows the general path created by the real-world data.
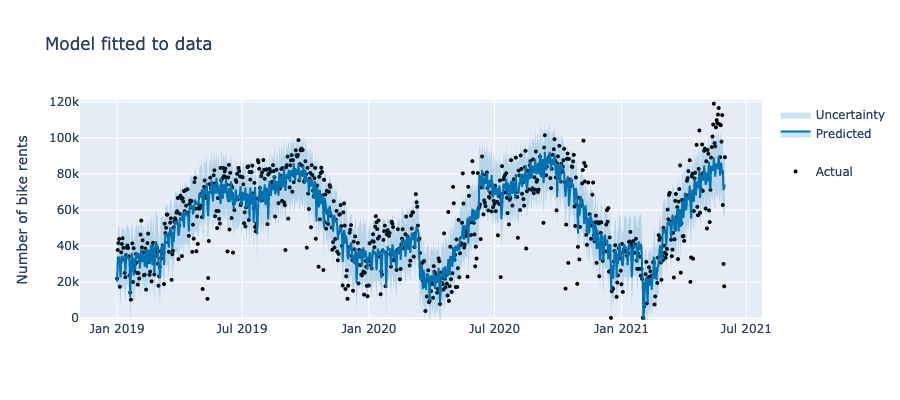
At this point, we are still not able to tell much about the data. What we need to do next is split this time series model into several components, each representing an underlying pattern of interest: trend, seasonalities, holiday effects. I’m sure you can’t wait to see the results; without further ado, let me pose the first question.
What is the general trend of city bike-sharing popularity?
When we look at the general trend behind the data, we will see that the number of rents has been steadily rising since January 2019.
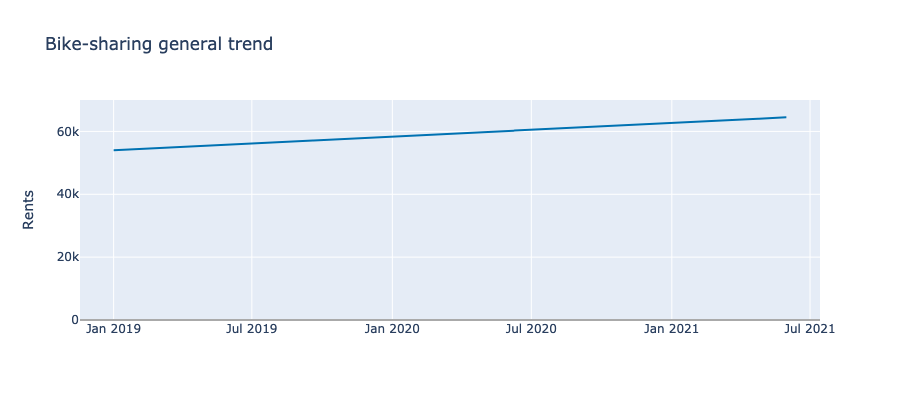
This indicates that more and more people use this means of transport every year. What we can not conclude here is what are the underlying reasons for this situation. Many factors can affect the trend. For instance, the population in the city might be growing in general, or the bike-sharing infrastructure is expanding and being made available for more people.
This general trend will serve us as a baseline. Next, we will see how this baseline is affected by the other components of the analysed model.
What are the yearly and weekly seasonalities?
One can easily guess that when the weather is warm, more people are likely to travel by bike. And when the temperature is low, riding a bike is not comfortable, and people are less keen to do it. We can see from the following chart that data can confirm this intuition.
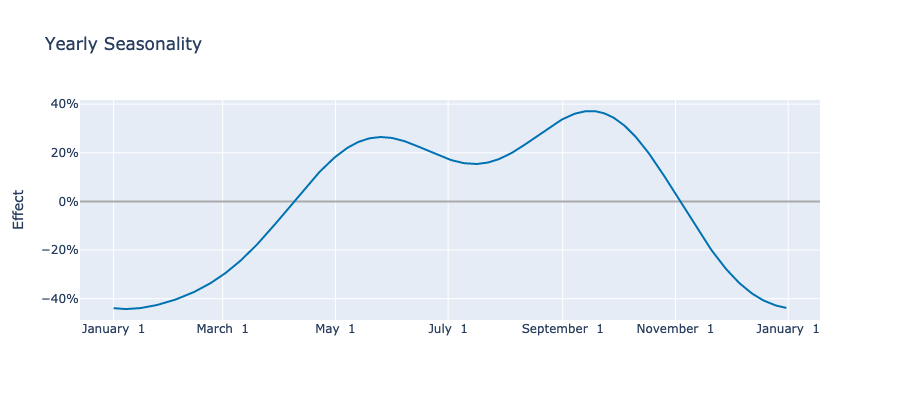
Due to the seasonality effect, bike rentals are reduced by approximately -40% in December and January. When it comes to the warm season, we can make an interesting observation that there is not one peak but two - the first one at the end of May with a maximum equal to 26%, and the second, bigger one, in the middle of September with a maximum equal to 38%. There is a slight decrease between these peaks with a minimum in July, where the effect drops to 15%. Two explanations have occurred to me so far. Firstly, it is the middle of the summer and physical activity during the hottest days is not comfortable. Secondly, the summer means the holiday season; hence, fewer people are travelling to work.
Keeping in mind the differences in the warm and cold seasons, I analysed the weekly seasonality for both of them separately.
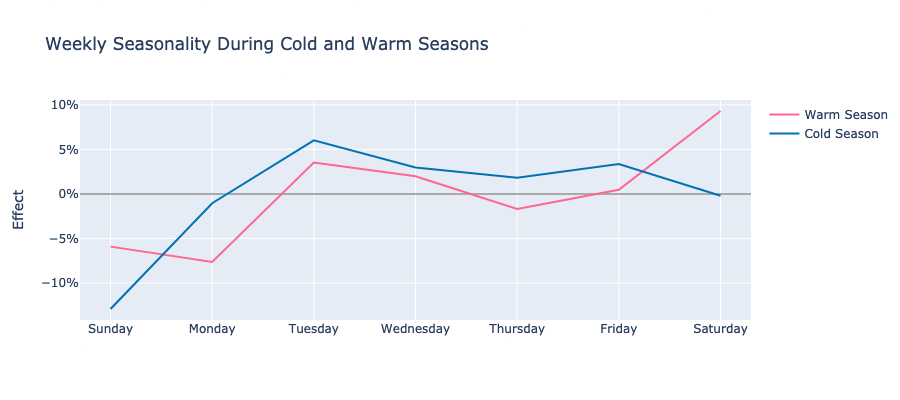
It turns out that during the working days the effect is similar. However, there is a notable difference on weekends. During the warm season, more people are renting bikes on Saturdays and Sundays. It can probably be explained by the fact that warm weather encourages them to spend their free time outside, they travel more or treat bike trips as a form of exercise and entertainment.
I know what you might be thinking - “How come the lockdown and COVID pandemic do not affect those numbers?”. Well, actually, they do.
How did the lockdown due to the COVID pandemic in 2020 affect the number of rents?
The first restrictions were introduced on the 12th of March 2020, and on the 8th of June 2020, New York City meets conditions for Phase 1 reopening. In the following chart, I present the difference between the usual effect and the effect during the lockdown.
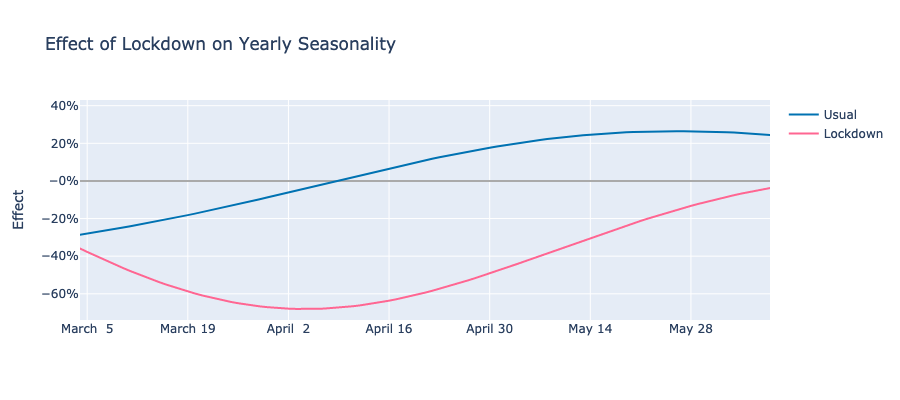
We can see that the decrease in the number of bike rents was significant. During the most severe restrictions, the effect was around -60%. But as time had passed, it was getting smaller.
And finally, the last question.
How do holidays influence the number of rents?
If we look at the impact of the main holidays in the United States on the number of bike rents, we will see that they have a negative effect. The strength of this effect varies from -0.5% for Veterans Day up to -9% for Columbus Day.
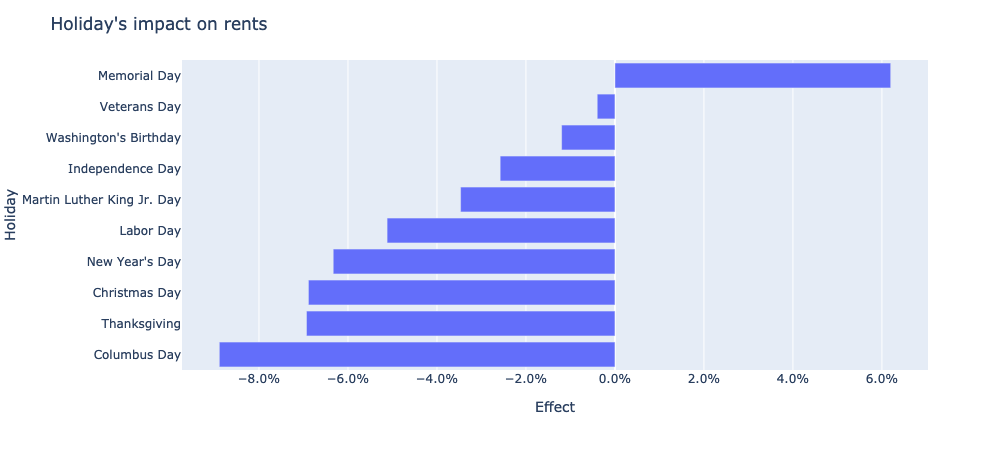
There is, however, one exception - Memorial Day - when many people visit cemeteries and memorials. This holiday increases the number of bike rents by 6.1%.
Conclusion
In this analysis we studied the underlying components of the bike rentals time series data in the area of New York.
Firstly, we looked at the general trend and discovered that it is steadily increasing year over year.
Next, we examined the yearly and weekly seasonality. As expected, the weather and air temperature have a massive influence on the baseline trend. Furthermore, the holiday season in the middle of summer has a negative impact on the number of rented bikes. And during the most severe restrictions due to lockdown, the negative effect reached over -60%.
And finally, bank holidays have also adverse effects on bike rentals, except Memorial Day.
The repository with the code is available here.